
Artifacts in fiber photometry#
What an artifact is#
Anything in the recorded fluorescence trace that does not reflect the biological signal of interest is considered an artifact. The biological signal is the indicator’s response to the molecule being measured (intracellular calcium for GCaMP, extracellular dopamine for dLight, and so on); everything else is an artifact.
The recorded trace is the sum of the biological signal and every artifact present in the recording:
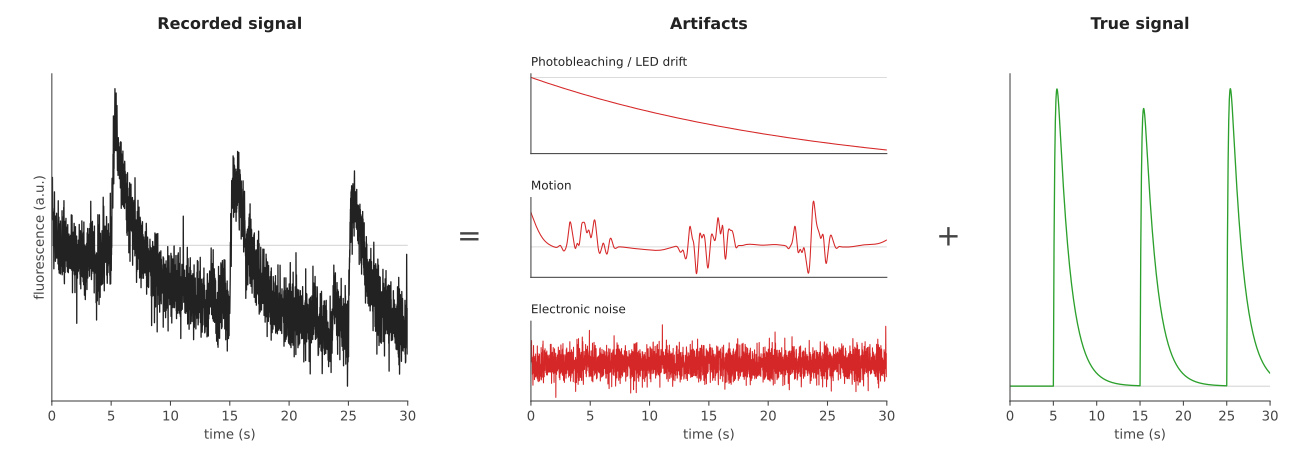
What the photometer reads (left) equals the artifact components (middle) plus the biological signal underneath (right). Each row in the catalogue below names one mechanism that contributes to the middle column; correction methods later in the page try to recover the right column from the left.
Artifact catalogue#
The fiber photometry literature names a small set of well-described artifact categories. The table below catalogues them with their physical mechanism.
Rows are grouped by where in the recording chain the artifact originates: from the LED at the excitation source, through the optical path (patchcord, fiber, ferrule, and implant tip), into the tissue under the fiber, and finally into the detection electronics. This grouping helps locate artifacts in the table; which correction method applies follows from other properties of the artifact, introduced in the next section.
Stage |
Artifact |
What it is |
|---|---|---|
Excitation source |
Electronic: LED drift |
Slow drift in excitation-source intensity from LED driver electronics: thermal warm-up, regulation drift, aging-driven output decline. Timescale is minutes to hours; appears as baseline drift in the recorded fluorescence. |
Excitation source |
Electronic: power flicker |
Fast changes in excitation-source intensity: mains-coupled ripple (50/60 Hz and harmonics), step transients when other equipment switches on shared circuits, sub-millisecond glitches from PWM-dimmed drivers. Sub-second timescale. |
Optical path |
Motion: patchcord (slow drift, bending) |
Cord between animal and hardware bends and drifts as the animal moves; mode loss attenuates both 470 and 405 channels proportionally. |
Optical path |
Motion: subject (head movement) |
The animal’s head movements transmit through the skull to the implant; the brain shifts slightly under the skull-mounted implant, so the fiber tip moves through tissue by a few microns. Reversible: the tip returns to a similar position when motion stops. Mode patterns and tip-tissue collection geometry change at both wavelengths, with a small residual that depends on wavelength. |
Optical path |
Motion: implant displacement (hard impact, fiber translates) |
Larger mechanical events at the implant: animal strikes cage wall, cable yanks past tolerance, fiber translates inside the ferrule, implant cement loosens over weeks. Often persistent, producing step changes in baseline rather than transient deflections. Optical-path geometry changes at the fiber tip with a small wavelength-dependent residual on top of a mostly-symmetric base. |
Optical path |
Autofluorescence: hardware (fiber cladding, ferrules, optics) |
Optical components themselves emit in the photometry detection band when illuminated. |
Tissue |
Indicator photobleaching |
Slow decay of fluorescent intensity over the session as fluorophore molecules are destroyed by absorbed photons. |
Tissue |
Hemodynamic absorption |
Blood-volume and oxygenation changes attenuate transmitted light. Hemoglobin’s Soret band near 415 nm absorbs much more strongly than 470 nm, and the HbO/HbR ratio shifts the cross-channel ratio over time. |
Tissue |
Autofluorescence: tissue (NADH, FAD, lipofuscin) |
Endogenous tissue fluorophores emit in the photometry detection band, with excitation spectra distinct from the indicator’s. |
Detection |
Electronic: electrical noise |
High-frequency noise injected into the detection path: amplifier electronics, photodetector dark current, ground loops, RF coupling (mobile phones, fluorescent lights). Light at the tissue is unaffected; the noise is added on top of the photocurrent. If both channels share electronics, the noise appears on both. |
Detection |
Electrical transients |
Brief non-optical events: solenoid clicks, TTL or valve switching coupling into photodetector electronics through ground loops, capacitive pickup, or shared power rails. Voltage spike on the detector output; if both channels share electronics, the transient appears on both. |
Detection |
Optogenetic crosstalk |
Stimulation photons leak through the detection filter and land on the photodetector. Leakage lands on the channel whose filter overlaps the stimulation wavelength (typically the indicator-sensitive channel for blue stim); magnitude depends on filter rejection. |
Artifact characteristics and correction methods#
The previous section grouped artifacts by where in the recording chain they originate. This section turns to the properties of the artifacts themselves, and how those properties determine which correction method can be applied to them.
Time structure. Whether the artifact is pervasive (present throughout the recording, with no clean baseline elsewhere in the session) or episodic (localised to specific time windows, with clean recording on either side). Photobleaching, hemodynamic drift, autofluorescence, and electronic noise are pervasive. Hard impacts, electrical transients, and optogenetic crosstalk are episodic.
Wavelength dependence. Whether the artifact produces the same time-course shape at the 470 nm signal channel and the 405 nm control channel, or different shapes. The property is a fact about the recording itself, observable before any correction is applied. Patchcord motion is approximately wavelength-independent (mode loss, the scattering of light out of the fiber when it bends, affects both wavelengths to first order equally); hemodynamic absorption (Soret band absorbs more strongly at 405 than at 470) and autofluorescence (different excitation spectra at the two wavelengths) are wavelength-dependent. Wavelength-independent artifacts are addressed by isosbestic correction.
Behaviour coupling. Whether the artifact’s time course is correlated with the experimental events that downstream analyses align to. Motion (animals move when they perceive cues, lick rewards, or transition between behavioural states) and hemodynamic absorption (arousal drives blood flow) are typically behaviour-coupled. Behaviour-coupled artifacts that survive upstream correction are a special concern for event-locked analyses; the PSTH explainer covers the event-aligned averaging mechanism.
Frequency content. Whether the artifact sits inside the biosensor’s kinetics frequency band, roughly 0.01-5 Hz, varying with indicator type and downstream smoothing. In-band artifacts have time courses on the same timescale as the real biological signal and cannot be removed by low-pass filtering without removing the signal. Off-band artifacts at higher frequencies (electronic noise, mains-coupled flicker, electrical transients) are cleanly separated by a filter above the kinetics band. Sub-mHz drifts (photobleaching, autofluorescence drift, LED drift) sit below the band but are similarly unreachable by low-pass filtering, so the catalogue groups them with the in-band rows.
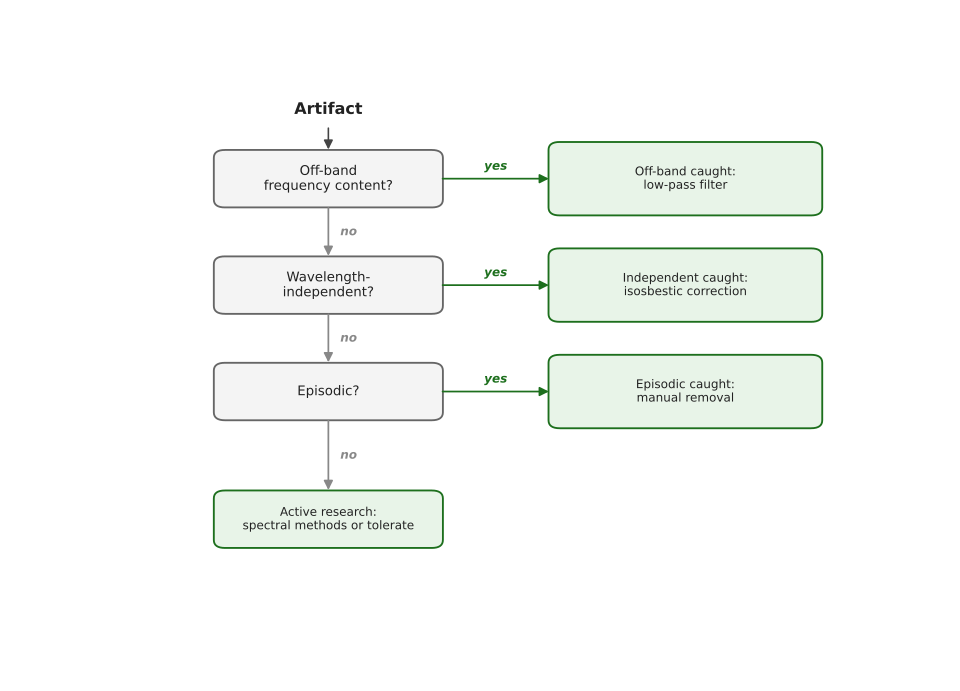
The decision tree below shows the routing logic for any new artifact: each stage tests one property and catches the matching artifacts, with the remainder passing through to the next stage. The routing reflects currently used methods, not a stable property of the artifacts; as the field develops new approaches, the tree will gain or lose branches.
Preventing artifacts through experimental design#
The corrections above all act on data that already contains the artifact. Experimental design works earlier, keeping artifacts out of the recording in the first place: red-shifted indicators (RCaMP, jRGECO, dLight variants) move the detection band away from hemoglobin’s Soret band entirely, and pre-bleaching the recording site saturates the fast-bleaching components of autofluorescence. What design cannot prevent it can still expose: control conditions that share the artifact-driving behaviour without the biological event let the experimenter detect and account for residual contamination statistically.
Artifact removal in GuPPy#
GuPPy removes two of these artifacts explicitly. Large episodic artifacts are removed in a manual step, where you mark the contaminated segments on the trace and exclude them (the removeArtifacts? parameter). The bright transient at the very start of a recording is dropped with the Eliminate first few seconds parameter. Other corrections are applied automatically during preprocessing: wavelength-independent artifacts such as motion are reduced by the isosbestic correction, and high-frequency noise by the moving-average filter (the Window for Moving Average filter parameter).